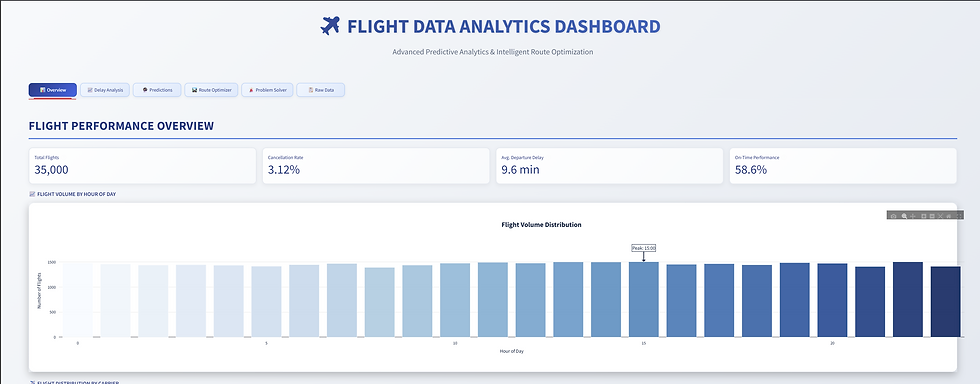
Flight-Data-Analytics-Dashboard
- Nour El banna
- Sep 10
- 4 min read
Flight Data Analytics Dashboard ✈️
Overview
The Flight Data Analytics Dashboard is an interactive web application built using Streamlit and Python, designed to provide insights into flight performance, delay patterns, and route optimization. It leverages synthetic flight data to simulate real-world airline operations, offering visualizations and predictive analytics to help users understand flight trends and make data-driven decisions. The dashboard includes features like advanced filtering, machine learning-based predictions, and problem-solving tools for operational efficiency.
Features
The dashboard is organized into six main tabs, each focusing on a specific aspect of flight data analysis:
📊 Overview: Displays key performance indicators (KPIs) such as total flights, cancellation rate, average departure delay, and on-time performance. Includes visualizations like flight volume by hour and distribution by carrier.
📈 Delay Analysis: Provides in-depth analysis of departure delays, including distribution histograms, average delays by hour and carrier, and a heatmap of delays by hour and carrier.
🔮 Predictions: Simulates predictive analytics for flight delays based on selected airline, origin, and destination. Features a gauge chart for delay probability and a table of contributing factors.
🛣️ Route Optimizer: Helps users find optimal flight routes by comparing carriers based on reliability scores. Includes machine learning-based predictions (Logistic Regression, Random Forest, or Gradient Boosting) for delay likelihood and visualizations of punctuality by hour.
🚨 Problem Solver: Identifies operational issues such as delays by airport, aircraft performance, route congestion, and carrier comparisons. Offers actionable recommendations to address identified problems.
📋 Raw Data: Displays a preview of the filtered dataset, provides statistical summaries for numerical and categorical columns, and allows users to download the data as a CSV file.
Key Functionalities
Advanced Filters: Filter data by carriers, origin/destination airports, aircraft types, time of day, and delay thresholds using an interactive sidebar.
Modern Visualizations: Utilizes Plotly for enhanced bar charts, line charts, pie charts, histograms, heatmaps, and gauge charts with modern styling and animations.
Machine Learning: Implements predictive models (Logistic Regression, Random Forest, Gradient Boosting) to estimate delay probabilities for specific routes and carriers.
Custom Styling: Features a modern, glassmorphism-inspired UI with gradient backgrounds, hover effects, and animated transitions for a polished user experience.
Data Download: Allows users to export filtered data as a CSV file for further analysis.
Installation
To run the dashboard locally, follow these steps:
Clone the Repository:
git clone cd flight-data-analytics-dashboard
Set Up a Virtual Environment (recommended):
python -m venv venv source venv/bin/activate # On Windows: venv\Scripts\activate
Install Dependencies: Ensure you have Python 3.8+ installed. Install the required packages using:
pip install -r requirements.txt
The requirements.txt file should include:
streamlit>=1.20.0 pandas>=1.5.0 numpy>=1.23.0 plotly>=5.10.0 scikit-learn>=1.2.0
Run the Application:
streamlit run app.py
This will start a local server, and the dashboard will be accessible in your browser at http://localhost:8501.
Usage
Launch the Dashboard: After running the application, the dashboard will open in your default web browser.
Apply Filters: Use the sidebar to filter data by carriers, airports, aircraft types, time periods, and delay thresholds.
Explore Tabs:
Navigate through the tabs to view different analyses and visualizations.
In the Route Optimizer tab, select origin and destination airports, choose a prediction algorithm, and click "Run Prediction" to get machine learning-based recommendations.
In the Problem Solver tab, select a problem type to analyze operational issues and view recommendations.
Download Data: In the Raw Data tab, download the filtered dataset as a CSV file.
Data
The dashboard uses synthetic flight data generated within the application to mimic real-world flight patterns. The data includes:
Columns: flight_id, carrier, origin, dest, scheduled_departure, scheduled_arrival, dep_delay, arr_delay, air_time, distance, cancelled, diverted, aircraft_type, route, hour_of_day, dep_delay_category, is_delayed, day_period.
Features: Realistic flight schedules, delays, cancellations, and aircraft types based on common U.S. airports and carriers.
Size: 35,000 flights with attributes like departure/arrival delays, flight distances, and aircraft types.
Note: The data is synthetic and used for demonstration purposes. Real flight data would provide more accurate and actionable insights.
Technical Details
Framework: Built with Streamlit for the web interface and Plotly for interactive visualizations.
Machine Learning: Uses scikit-learn for predictive modeling, with support for Logistic Regression, Random Forest, and Gradient Boosting classifiers.
Styling: Custom CSS with glassmorphism effects, gradient backgrounds, and animations for a modern UI.
Data Processing: Employs pandas for data manipulation and numpy for numerical computations.
Caching: Utilizes Streamlit's @st.cache_data to optimize data loading and processing.
Limitations
The dashboard uses synthetic data, which may not fully capture real-world complexities.
Machine learning predictions are based on simplified features and may not reflect production-grade models.
The application is designed for single-user, local deployment. For multi-user or production use, additional configuration (e.g., hosting on Streamlit Community Cloud) is required.
The UI is optimized for desktop browsers; mobile responsiveness may require further adjustments.
Future Improvements
Integrate real-time flight data from APIs like FlightAware or AviationStack.
Enhance machine learning models with more features (e.g., weather data, crew scheduling).
Add support for multi-leg flight planning in the Route Optimizer.
Implement advanced anomaly detection for the Problem Solver tab.
Optimize performance for larger datasets using data streaming or database integration.
License
click on the image to see more about the project ⬆️
Contact
For questions or feedback, please contact the developer at nousahmedalbanna@gmail.com


Comments